Gels
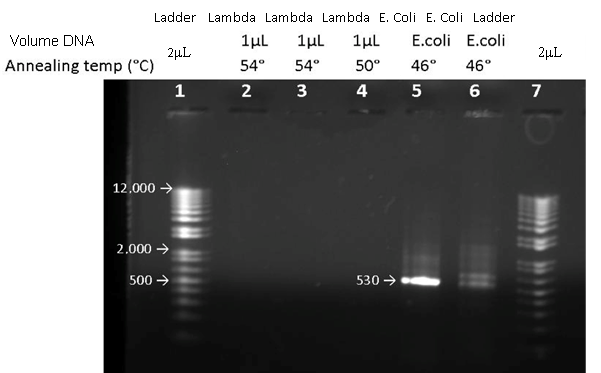
Figure 1. Successful amplification of E. Coli 16S gene. Gel electrophoresis was conducted in a 0.8% TBE gel to analyze amplified segments of DNA. Lanes five and six contained amplified bands of E. Coli DNA near targeted band length, 530 base pairs. 3mL of 8F Primer, 3mL of 529R Primer, 2mL of DNTP’s, 5mL PCR buffer, 1mL Taq polymerase, 1mL MgCl2 and 45mL water were used in the PCR. Lanes one and seven corresponds to a 1x KB+ ladder (2mL). Lanes two, three and four contained Lambda virus primers and Human S9 DNA. Lanes five and six showed some non-specific binding but the targeted band length of 530 base pairs was the most distinct band for lane five and showed up as one of the two brightest bands in lane six. It was found that successful PCR amplification of E. Coli ribosome 16S gene occurs with an annealing temperature of 46°C and 3mL of primers.
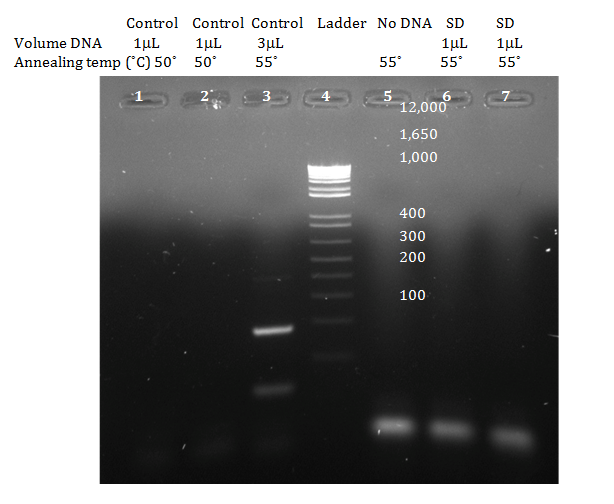
Figure 2. Successful PCR amplification of DNA segment containing A4V mutation site while varying DNA template volume, primer volume and annealing temperature. Gel electrophoresis was conducted in 0.8% LB gel run at 216V to analyze results of PCR. An expected band length of 182 base pairs was the most distinct band found in lane three which also contained non-specific binding. Lanes one and two contained 3mL control forward primers, 3mL control reverse primers with 1mL of DNA whereas lane three contained 1mL of both forward and reverse control primers with 3mL of purified S9 human epithelial cells. The remaining components stayed the same for the two PCR cocktails; 1mL Taq polymerase, 1mL MgCl2 ions, 5mL PCR buffer, 2mL DNTPs. Lane four corresponds to a 1x KB+ ladder (2mL). Lane five served as a control for primer dimer, it contained the same components of the PCR cocktail in lanes one and two without template DNA. Results showed bright bands at the bottom of the gel which meant successful primer-dimer annealing. Lanes six and seven showed primer dimer for PCR amplification of site directed primers with 1mL of wild type DNA at 55˚C. Based on results from this gel it can be concluded that higher volumes of template DNA and an annealing temperature of 55˚C are optimal conditions to successfully amplify our control primers.
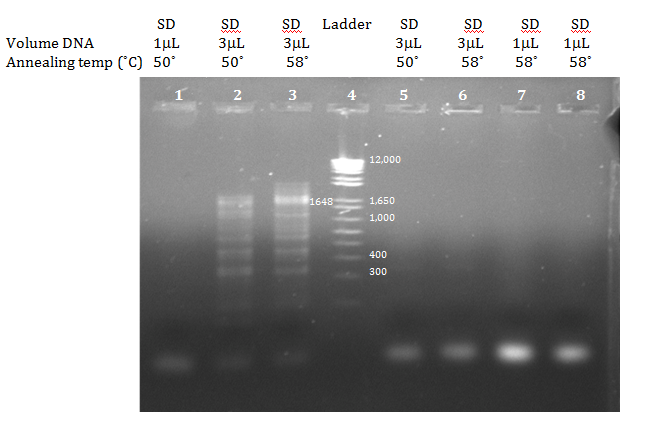
Figure
3. PCR amplification of DNA segment containing A4V mutation site
using designed site directed primers while varying reaction cocktail
components and annealing temperatures. Gel electrophoresis was
conducted in 0.8% LB gel run at 216V to analyze results of PCR.
Expected band length for site directed primers was 1648 base pairs
long. Lane four corresponds to a 1x KB+ ladder (2mL).
Lanes one, seven and eight used a PCR cocktail with the
following components: 3mL site directed forward
primers, 3mL site directed reverse primers, 1mL
wild type DNA template, 1mL Taq polymerase, 1mL
MgCl2 ions, 5mL PCR buffer, 2mL
DNTPs and 44mL water. This cocktail was run in the
thermocycler with an annealing temperature of 50°C and
58°C. The results showed primer dimer at both annealing
temperatures, but more distinctly at the annealing temperature of 58°C.
Another reaction cocktail was tested in lanes five and six that
contained 3mL site directed forward primers, 3mL
site directed reverse primers, 3mL wild type template
DNA, 1mL MgCl2 ions, 4mL DNTPs,
5mL PCR buffer, 1mL Taq polymerase and 30mL
water. This cocktail was tested at 50°C and 58°C
and did not show positive results. A final reaction cocktail was
used in lanes two and three. This cocktail contained 1mL
site directed forward and reverse primers, 3mL wild
type DNA template, 2mL DNTPs, 1mL MgCl2
ions, 1mL Taq polymerase and 51mL water.
The expected band length of 1648 base pairs showed up in both lanes
but more distinctly in lane three with an annealing temperature of
58°C. Both lanes showed non-specific binding. It was
concluded that higher annealing temperatures, lower primer volumes,
and higher DNA template volumes were optimal in obtaining positive
results using our site directed primers.
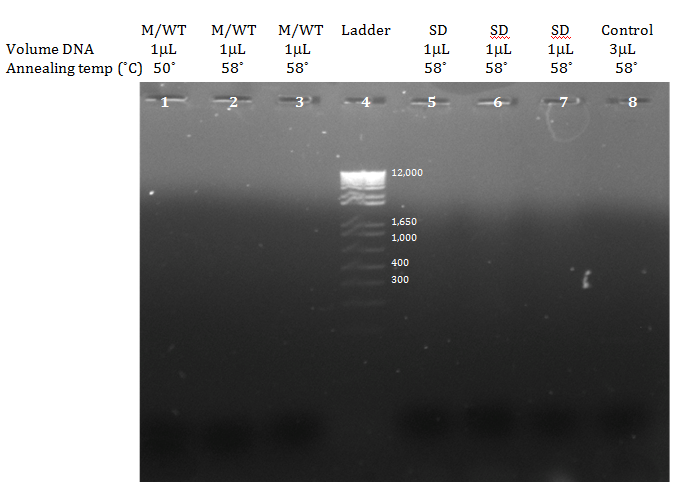
Figure 4. PCR amplification of mutant primers vs. wild type DNA. After running gel electrophoresis on a 0.8% LB gel at 216V, an analysis of bands amplified through PCR was conducted. Lane four corresponds to 2mL sample of 1x KB+ ladder. This ladder showed a ripple like effect in its bands, which was likely caused from gel construction. Lanes five, six, and seven contained a PCR cocktail with 1mL of purified S9 human epithelial cell DNA, 1mL MgCl2 ions, 5mL PCR buffer, 2mL DNTPs, 3mL site directed forward primers, 3mL site directed reverse primers, 34mL water and 1mL Taq polymerase. The annealing temperature was 58˚C and gel electrophoresis showed that PCR was unsuccessful. Lane eight contained 1mL control forward primers, 1mL control reverse primers, 3mL wild type DNA, 5mL PCR buffer, 1mL Taq polymerase, 1mL MgCl2 ions, 2mL DNTPs and 46mL water and had an annealing temperature of 58°C. This lane showed unsuccessful results. Lanes one, two and three served as a negative control. They tested mutant primers vs. wild type DNA. Therefore, no bands were expected to show up. The PCR cocktail contained 1mL wild type DNA, 1mL MgCl2 ions, 1mL Taq polymerase, 2mL DNTPs, 3mL mutant forward primers, 3mL reverse primers, 5mL PCR buffer and 44mL water. Lane one had an annealing temperature of 50°C and lanes two and three had an annealing temperature of 58°C. No bands showed up in lanes one through three, so it can be concluded that our mutant primers did not anneal to wild type DNA.
Graphs
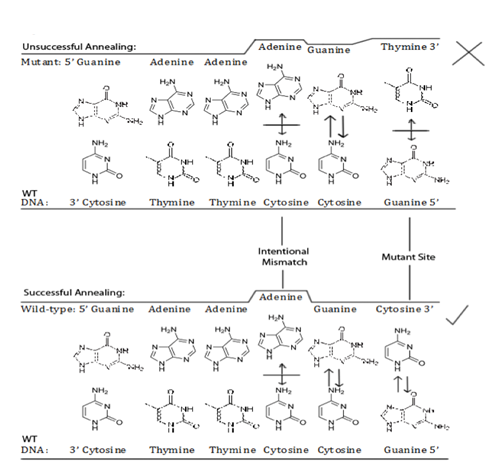
Figure 5. Representation of the Yaku method of primer design (Yaku et al, 2008). The top row represents unsuccessful extension due to combining mutant primers with wild type DNA. The mutant site is present at the last base pair on the 3’ end of the primers. The mutation is a missense mutation that changes the base pair cytosine to thymine, which corresponds to an Alanine to Valine amino acid switch. Yaku’s method includes an intentional mismatch at the third to last base pair from the 3’ end of the designed primer. The intentional mismatch prevents elongation of primers to the unintended DNA strand (i.e. wild type primer and mutant DNA or mutant primer and wild type DNA) by having two mismatches that physically further expand the primer from the DNA template. Without the intentional mismatch two base pairs prior to the mutation it is more likely for the primer to extend further because the strands are physically closer together. Row two represents successful annealing using Yaku’s method of primer design. When primers with their respective DNA templates anneal, the intentional mismatch does not prevent further extension of the primer. This is because the distance between the strands created by a one base pair mismatch is small enough that extension is possible from the primer re-annealing.
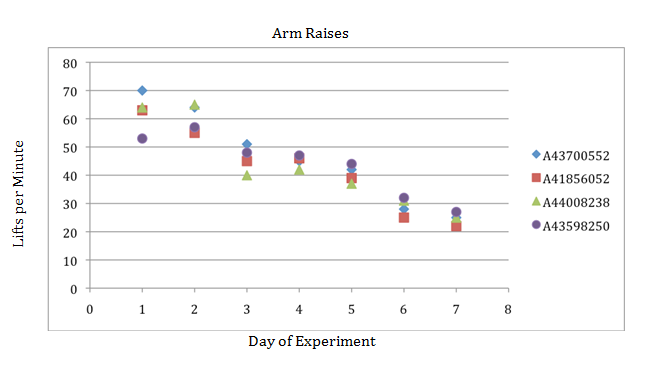
Figure
6. Maximum amount of arm rises in one minute, recorded at the end of
each day of the psychophysical experiment.
This experiment simulated what it is like to live with ALS. Due to
the progressiveness of the disease it was hypothesized that over the
length of the experiment the researcher would observe a decrease in
the amount of times he or she could raise their arms at the end of
each day participating in the study. To simulate living with ALS,
researchers wore 0.45 kg weights on their arms for the first two
days of the experiment, 1.35 kg weights from days three to five, and
2.70 kg weights on each arm and being restricted to a wheel chair
during days six and seven to simulate reduced mobility and the
progressiveness of the disease. Researchers recorded the number of
times they were able to lift their hands above their head in a
sitting position with the respective weights on their arms in one
minute. The purpose of recording a researcher’s physical ability to
lift their arms above their head with increasing weights as the
experiment progressed is to see if there was a direct correlation
between decreased mobility and progressiveness of the symptoms. An R2
value of 0.922735 (p<0.0001) was obtained for the arm rises per day
data, which showed that there is a strong correlation between amount
of arm lifts and progression of the experiment and that
statistically, our data was significant.
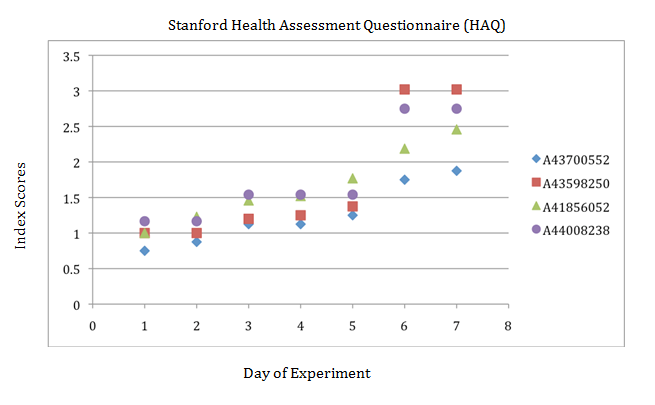
Figure
7. Correlation between the degenerative nature of ALS and the
weakening of a psychophysical state according to the Stanford HAQ.
Results of the Stanford HAQ for the psychophysical experiment
showed an increase in Index scores for all four researchers over a
span of seven days. To simulate living with ALS, researchers wore
0.45 kg weights on their arms for the first two days of the
experiment, 1.35 kg weights from days three to five, and 2.70 kg
weights on each arm and being restricted to a wheel chair during
days six and seven to simulate reduced mobility and the
progressiveness of the disease. At the end of each day of the
research experiment researchers took the Stanford HAQ to assess how
difficult it was to do everyday things such as dressing yourself or
walking up five stairs. Researchers rated the difficulty of doing
such tasks on a scale of one to four, four being most difficult.
Tasks were grouped into categories and the average of each category
was taken. Then an overall average for each day was taken. It was
hypothesized that over the span of the seven days, as the symptoms
of the disease worsened, the index score of the HAQ would increase
progressively. It was found that a correlation exists between the
progression of the experiment and higher scores on the Stanford HAQ.
A R2 value of 0.8607 (p<0.0001) was obtained for the HAQ
index scores. This shows that there was a significant correlation
between the progression of the experiment and the Index scores
obtained from the Stanford HAQ and that statistically our data was
significant.
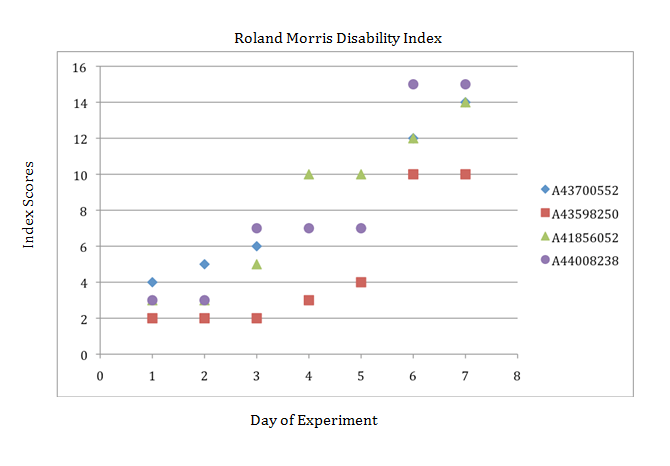
Figure 8. Correlation between the psychological state and physical ability as symptoms of the experiment worsened. Results of the Roland Morris Disability Index over span of psychophysical experiment showed an increase in Index scores for all four researchers over a span of seven days. To simulate living with ALS, researchers wore 0.45 kg weights on their arms for the first two days of the experiment, 1.35 kg weights from days three to five, and 2.70 kg weights on each arm and being restricted to a wheel chair during days six and seven to simulate reduced mobility and the progressiveness of the disease. At the end of each day of the research project, researchers took the Roland Morris Disability Index to assess how their arm pain made them feel about doing everyday things such as getting out of a chair or getting dressed. Researchers marked off each task that they felt described them that day. For example, if they felt more irritable around other people that day due to their arm pain they would place a mark next to that task. Each day the numbers of marks were tallied up to give a total for each day out of a possible 24 marks. An R2 value of 0.8602 (p<0.0001) was obtained for the Disability Index score. This showed a correlation between the Index score and progression of the experiment and that statistically, our data was significant.